Intro
Have you ever wanted to view or stream metrics from your Pi's and set it up with Docker? We'll take a look into how we can get this done below.
I'm not conversant with Docker and know very little about containerization, so I began this project. Coming out the other side of this project, I will have learned much more than I did before starting this – about how Docker works and everyday tasks to be carried out via CLI.
Note: For users comfortable with docker-compose files, you can go ahead and use the compose file I created on my GitHub. You will still need to install the node_exporter on any Pi's you want to monitor and make a Prometheus.yml file. All that info is below.
The goal of this project
- Set up Docker and better understand the basics.
- Use Docker to install Prometheus to stream telemetry from 2 Raspberry Pi's and insert it into user-friendly graphs in Grafana, which will run on an additional container, all on one Pi.
Install Docker on a Pi
Docker and the associated containers will be installed on a Pi 3, running Ubuntu 20.04 LTS arm.
The official instructions for installing Docker on Pi can be located here.
First off, on your pi via CLI, you want to update your apt package index and install packages to use repositories over HTTPS;
sudo apt-get update

sudo apt-get install \
    apt-transport-https \
    ca-certificates \
    curl \
    gnupg \
    lsb-release
Add Dockers official GPG key;
curl -fsSL https://download.docker.com/linux/debian/gpg | sudo gpg --dearmor -o /usr/share/keyrings/docker-archive-keyring.gpg
Set up the Stable repository. This sets up the repository using the stable version of Docker.
echo \
  "deb [arch=arm64 signed-by=/usr/share/keyrings/docker-archive-keyring.gpg] https://download.docker.com/linux/debian \
  $(lsb_release -cs) stable" | sudo tee /etc/apt/sources.list.d/docker.list > /dev/null
Install the Docker engine.
sudo apt-get update
sudo apt-get install docker-ce docker-ce-cli containerd.io
Test to verify everything is working correctly.
sudo docker run hello-world
This should pull and run a docker image that outputs a message and closes itself off.
Note; If you want to clean up and remove the hello-world image from your pi, run $sudo docker ps -a, locate the container ID, then run $sudo docker rm containerID".
sudo docker ps -a
## this will display containers installed.
## locate the container ID

sudo docker rm containerID
## replace containerID with the container ID you want to remove.
We have now installed and tested Docker running on your Pi.
Want to join a Discord community of folks who love (and occasionally hate) infrastructure? Join us! It’s like a group therapy session, but for infra.
Installing Grafana via a Docker container
The official instructions for installing Grafana via Docker can be located here.
Running Grafana as a barebones docker image is pretty simple. However, you can also run it with various plugins, which can get a bit more complex, so we'll leave that for another day.
To run and name your Grafana container;
docker run -d -p 3000:3000 --name grafana grafana/grafana
## this sets up the docker container to run on port 3000 and name the container grafana.
Find out if the container is running, the correct ports, etc.
sudo docker ps -a
You should now see your Grafana container running on port 3000.

Ansible playbook running and complete.
Go ahead and browse to your Pi's IP, and set the port as 3000 (http://X.X.X.X:3000). You should now see your Grafana homepage and be prompted to enter a username and password.

Username: Admin, Password: Admin.
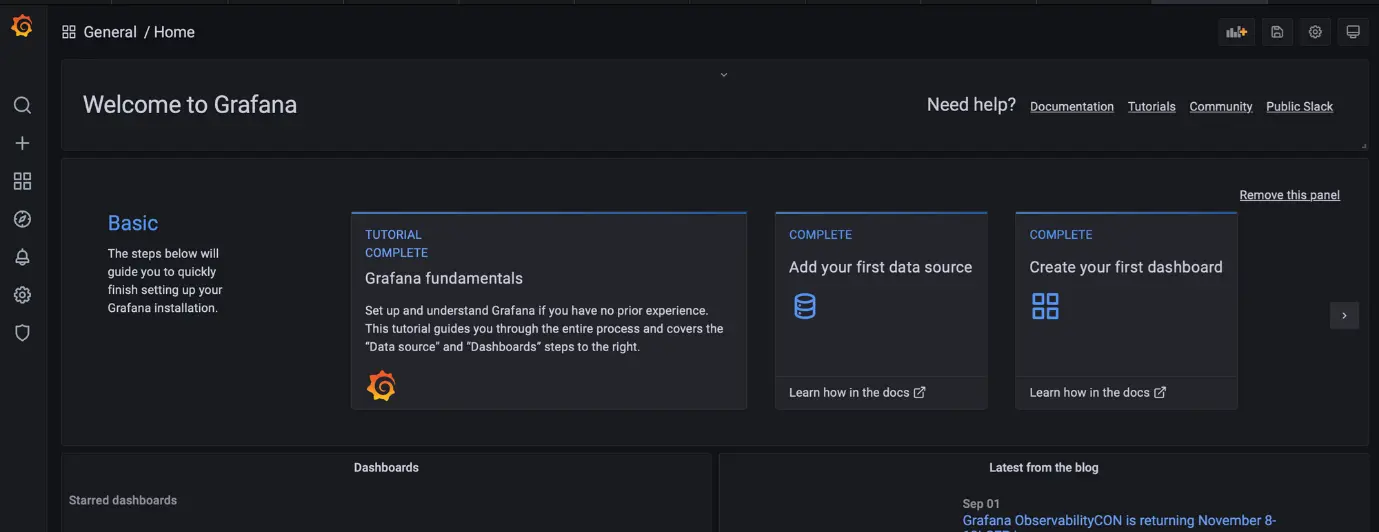
Initial welcome screen of the Grafana dashboard
Installing Prometheus via a Docker container
Prometheus is the time series database that records the metrics it gets fed and allows those metrics for use elsewhere.
The official instructions for setting up Prometheus on Docker can be found here.
Setting up and running Prometheus requires a bit more work. First, there is a configuration file called prometheus.yml, which tells the Prometheus service what targets to pull data from, and we need a way to feed this into the container.
There are 2 different methods of feeding the container this .yml file.
You can either bind-mount the config file or the directory, so it maps into /etc/prometheus in the container. In this example, we will go with the first option, bind-mount the config from the host. The instructions for the alternative method can be found in the link here.
First off, let's create your prometheus.yml config file.
Move to any directory you wish for this config file to be located (for myself, I set mine in /home/ubuntu/docker-images) and run the below command.
nano prometheus.yml
In nano, you're going to paste the following, but pay special attention to the bottom of the config file that reads "static configs". The default target, as displayed below (localhost:9090), allows its own metrics to be captured, but remember, it will only capture the metrics from resources inside the container. But for this example, we want to capture metrics from our Pi(s).
Create a new target, and set it to your raspberry pi's IP address with the port number :9100. An example is the default config displayed below. We'll explain why you need to utilize port 9100 a little later.
Default Prometheus.yml
# my global config
global:
  scrape_interval:     15s # Set the scrape interval
  evaluation_interval: 15s # Evaluate rules every 15 seconds
  # scrape_timeout is set to the global default (10s).

# Alertmanager configuration
alerting:
  alertmanagers:
  - static_configs:
    - targets:
      # - alertmanager:9093

# Load rules once and periodically evaluate them
# according to the global 'evaluation_interval'.
rule_files:
  # - "first_rules.yml"
  # - "second_rules.yml"

# A scrape configuration containing one endpoint to scrape:
# Here it's Prometheus itself.
scrape_configs:
  # The job name is added as a label `job=<job_name>`
  # to any timeseries scraped from this config.
  - job_name: 'prometheus'

    # metrics_path defaults to '/metrics'
    # scheme defaults to 'http'.

    static_configs:
    - targets: ['localhost:9090']
Example Pi targets at the bottom of the config
# my global config
global:
  scrape_interval:     15s # Set the scrape interval
  evaluation_interval: 15s # Evaluate rules every 15 seconds
  # scrape_timeout is set to the global default (10s).

# Alertmanager configuration
alerting:
  alertmanagers:
  - static_configs:
    - targets:
      # - alertmanager:9093

# Load rules once and periodically evaluate them
# according to the global 'evaluation_interval'.
rule_files:
  # - "first_rules.yml"
  # - "second_rules.yml"

# A scrape configuration containing one endpoint to scrape:
# Here it's Prometheus itself.
scrape_configs:
  # The job name is added as a label `job=<job_name>`
  # to any timeseries scraped from this config.
  - job_name: 'prometheus'

    # metrics_path defaults to '/metrics'
    # scheme defaults to 'http'.

    static_configs:
    - targets: ['localhost:9090']
    - targets: ['192.168.1.99:9100']
    - targets: ['192.168.1.100:9100']
When done with the config file, hit ctrl+x and save.
That's your config file for prometheus sorted.
Next step, we're going to bind-mount your config file to Prometheus on boot. Run the below command paying attention to /path/to/prometheus.yml. Make sure to put the path of your config file in. If unsure, browse to the directory you set it up to, and run $ pwd. This will print the current directory. Copy and paste that replacing /path/to/
docker run -d \
-p 9090:9090 \
--name prom \
-v /path/to/prometheus.yml:/etc/prometheus/prometheus.yml \
prom/prometheus
–name prom – Names the container prom for easier use.
To confirm it all went to plan, run the below and check to see if your Prometheus container is running;
sudo docker ps -a
You should now have a similar output to the above. For example, Prometheus running on port 9090 because, remember, in the docker run command, we specified -p as 9090:9090, and Grafana running on port 3000.
Now, go ahead and see if you can web browse to the Pi address on that port (http://X.X.X.X:9090); you should be greeted with the Prometheus home page.

Initial Prometheus dashboard/ page
It's a little empty here, but that's OK.
So, there's the Prometheus Docker container installed.
Set up the Prometheus -> Grafana connector
We now want to link Prometheus to Grafana, so the metrics can be read and displayed by Grafana in any of its dashboards.
Log in to your Grafana service using port :3000, hit the little cog on the left of your window, and select "Data sources".
On the right of your screen, you should see a button that reads "Add Data Source". Give that a hit.

Configuration screen for Prometheus
The first option at the top of the new Data Sources page should be Prometheus, click it, and it'll take you to the configuration page for the Prometheus time series database.
The barebone basics are pretty easy to get sorted here. First, you're simply going to enter a name and an IP address with the port number. Remember, your Prometheus container is running on port 9090, so go ahead and put in the IP of your Pi/ Linux server, followed by port 9090, similar to below.

Head to the bottom of the page, and hit "Save & test". If successful, you should have a small pop-up to advise "data source is working".
That's the config for the Prometheus connector done.
Let's test it.
Next, we're going to see if we can pull the metrics of the Prometheus container into Grafana and display it in a friendly dashboard.
On the left of your Grafana screen, click the 4 little boxes/windows and select "Manage".
Grafana has many pre-made dashboards, some created by Grafana and others by the community. So we'll import a pre-built dashboard for Prometheus metrics for simplicity's sake.
The dashboard we will be utilizing from the community is Prometheus 2.0 Overview. If you take a look at that pre-made dashboard, you'll see on the right there is a dashboard ID. Go ahead, and copy that; it should be 3662.
Back on the Prometheus app, you should see an import button on the right side of your screen, click that, and you should be brought to a new screen asking for the Grafana dashboard ID or URL. Enter the dashboard ID of 3662 and click "Load".
You should now be greeted with information based on the dashboard we selected. At the bottom of the screen, click the box below where it says "Prometheus", and you should see your Prometheus server we connected to earlier. Select that and hit import.
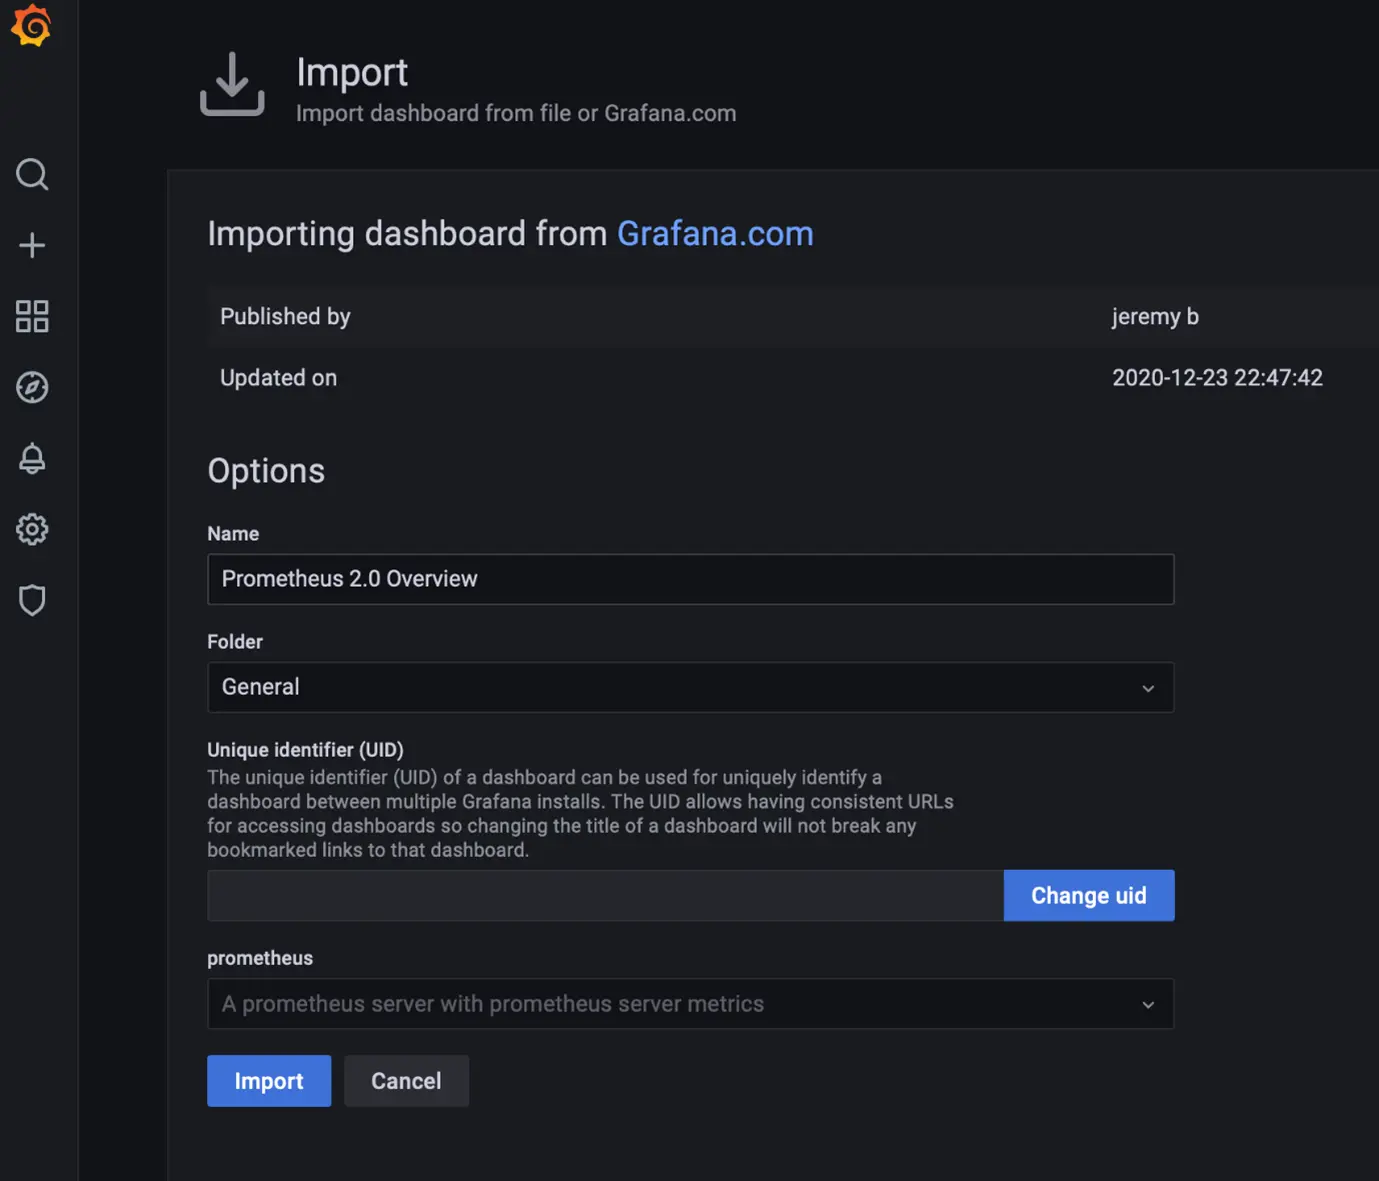
Output from the dashboard import
Congratulations, you should now see the metrics provided by your Prometheus container's Prometheus database. Scroll down and take a look.
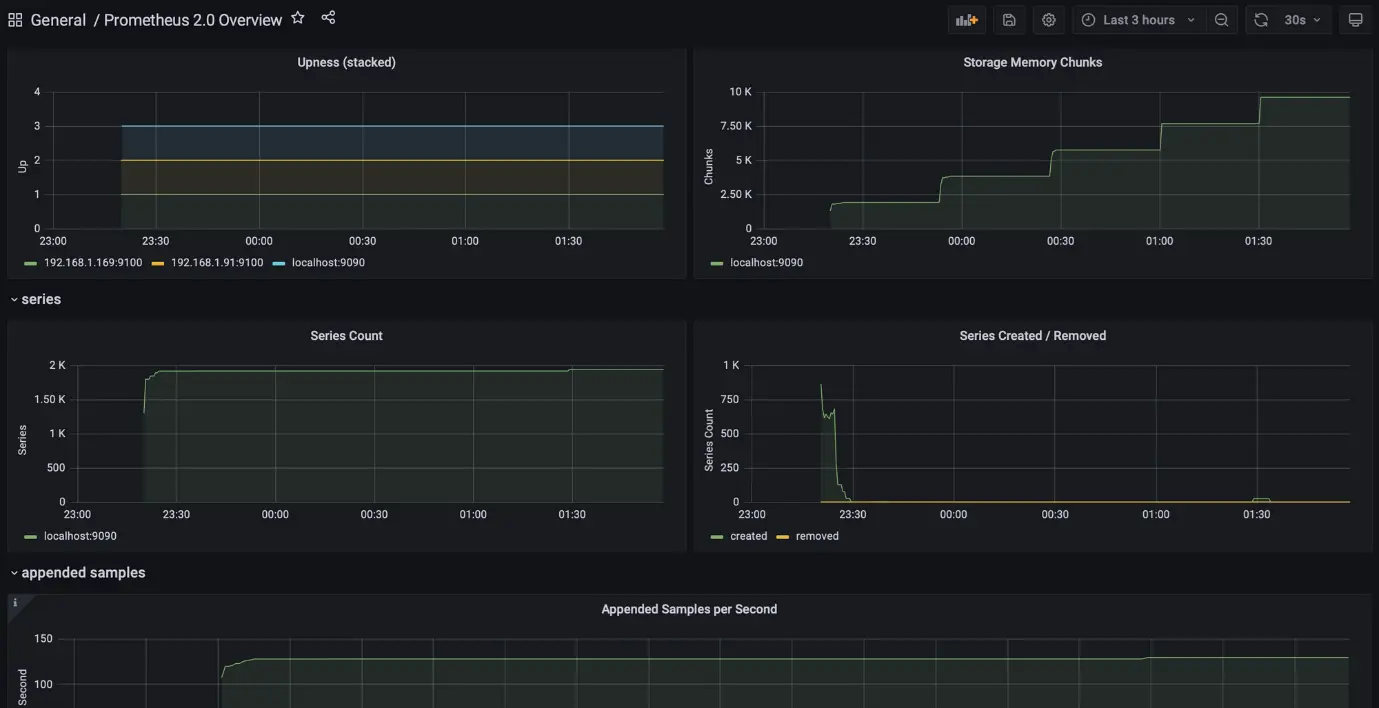
You can change the sampling period by hitting the dropdown box at the top right of your screen.
Please consider tipping a little something to show your appreciation for the content and to help me keep the site going. We accept a range of convenient payment options, including Apple Pay, Google Pay, and more.
Kofi Page
Ducko.Dev via Stripe
Feeding Pi/ Linux server metrics into Prometheus
The final step, and for me, the most exciting.
We need to feed metrics from our Pi into Prometheus, so we can report on it in Grafana.
Want to join a Discord community of folks who love (and occasionally hate) infrastructure? Join us! It’s like a group therapy session, but for infra.
To do this, we must install the Prometheus node_exporter on our Pi's.
Head over to the Prometheus downloads page. The installation can get a little funky if we don't select the correct version.
Head to the top of the page, select Operating system as Linux, and architecture armv7. The Pi 1 and Zero both use the ARMv6 architecture, and the Pi 2,3,4 utilize ARMv7. So for this example, I'm using a Pi3, so I'll select ARMv7. Obviously, change this depending on your own architecture.
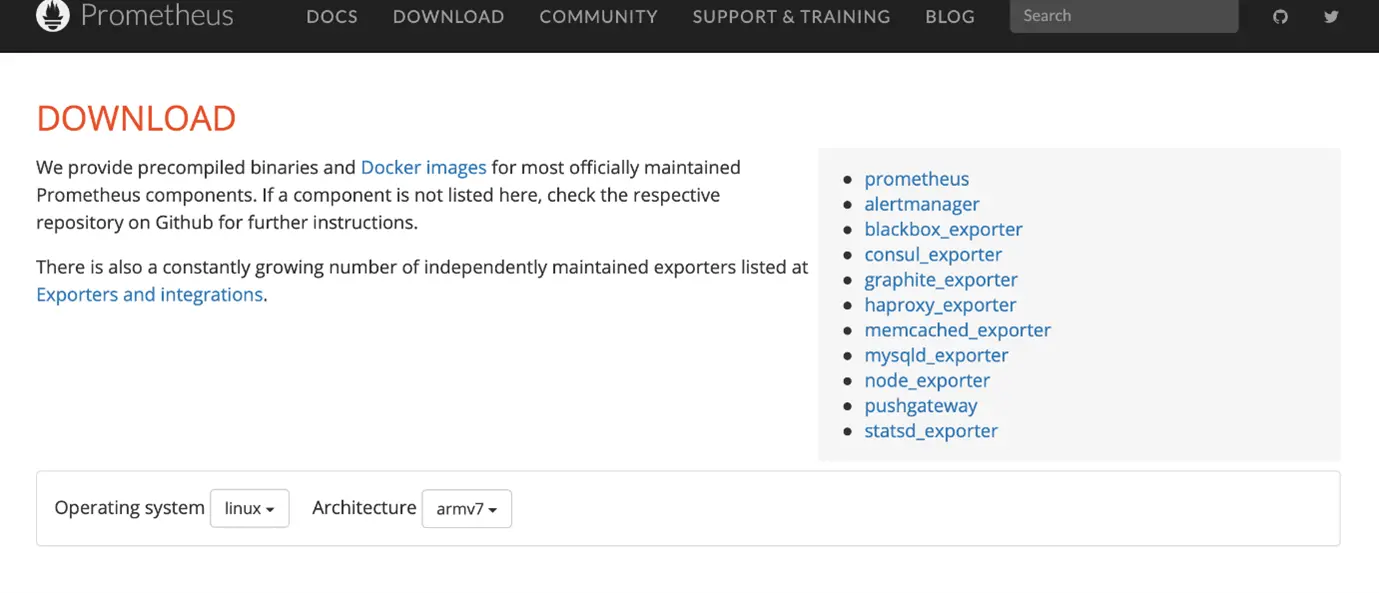
Head back down the page to the "node_exporter" downloads. Right-click and select "copy link".

On your Pi/ Linux server, head to your home directory, and we'll go ahead and download the node_exporter file.
wget github.com/prometheus/node_exporter/releases/download/v1.2.2/node_exporter-1.2.2.linux-armv7.tar.gz
## replace the github url with the one we just copied from the website removing the https:// prefix.
The file we just downloaded is compressed, so we'll need to expand it.
tar xfz node_exporter-1.2.2.linux-armv7.tar.gz
## replace the filename with your filename, depending on architecture
 and version
For cleanliness, we want to remove the tar file and rename the expanded folder we just obtained.
rm node_exporter-1.2.2.linux-armv7.tar.gz
## removes the tar file

mv node_exporter-1.2.2.linux-armv7 node_exporter
## renames the file. You can hit tab to autocomplete long names.
This folder now contains the script for the node_exporter that Prometheus requires.
Next, we want to make sure the node_exporter starts on bootup. To do this, follow the below.
Firstly, we want to create a service file, which we will call node_exporter.service. We want to place this in the /etc/systemd/system/directory.
sudo nano /etc/systemd/system/node_exporter.service
Paste the following into the nano window;
Note: Please pay special attention to the User under service. If you're using a different OS, your user ID will need to be changed. For example, Raspbian will require the User ID: pi.
[Unit]
Description=Node Exporter
Wants=network-online.target
After=network-online.target

[Service]
User=ubuntu
ExecStart=/home/ubuntu/node_exporter/node_exporter

[Install]
WantedBy=default.target
CTRL+X and save the file.
Before we start the new service, we require a reload of the systemd manager.
sudo systemctl daemon-reload
Now we can bring up the node_exporter service.
sudo systemctl start node_exporter
We need to find out if the service started successfully, and there are a couple of ways we can do this;c
sudo systemctl status node_exporter
## Will display the status of the service.

cat /var/log/syslog
## will display syslog, but the last messages should be related to the service.
The service should now be up.
I've had multiple issues with this step on different pi/ Linux operating systems; if you experience any problems, it can be for many reasons.
The best way I've found to resolve most of these issues is by moving the node_exporter directory to /usr/local/bin and re-adjusting the node_exporter.service file we created above and change the directory to ExecStart to /usr/local/bin/node_exporter/node_exporter.*
Now we'll enable the service to startup on boot;
sudo systemctl enable node_exporter
The node_exporter service should now be running, so point your web browser to the IP address of your Pi/ Server on port number:9100 (http://X.X.X.X:9100).
You should now be on the page for the node exporter. Click metrics and see the displayed output similar to below on that page;
# HELP go_gc_duration_seconds A summary of the pause duration of garbage collection cycles.
# TYPE go_gc_duration_seconds summary
go_gc_duration_seconds{quantile="0"} 0.000294113
go_gc_duration_seconds{quantile="0.25"} 0.000427708
go_gc_duration_seconds{quantile="0.5"} 0.000638852
go_gc_duration_seconds{quantile="0.75"} 0.000717341
go_gc_duration_seconds{quantile="1"} 0.008199092
go_gc_duration_seconds_sum 0.444998166
go_gc_duration_seconds_count 675
# HELP go_goroutines Number of goroutines that currently exist.
# TYPE go_goroutines gauge
go_goroutines 9
# HELP go_info Information about the Go environment.
# TYPE go_info gauge
go_info{version="go1.16.7"} 1
# HELP go_memstats_alloc_bytes Number of bytes allocated and still in use.
# TYPE go_memstats_alloc_bytes gauge
go_memstats_alloc_bytes 2.90824e+06
# HELP go_memstats_alloc_bytes_total Total number of bytes allocated, even if freed.
# TYPE go_memstats_alloc_bytes_total counter
go_memstats_alloc_bytes_total 1.294082872e+09
# HELP go_memstats_buck_hash_sys_bytes Number of bytes used by the profiling bucket hash table.
# TYPE go_memstats_buck_hash_sys_bytes gauge
go_memstats_buck_hash_sys_bytes 780660
# HELP go_memstats_frees_total Total number of frees.
# TYPE go_memstats_frees_total counter
go_memstats_frees_total 1.3379218e+07
# HELP go_memstats_gc_cpu_fraction The fraction of this program's available CPU time used by the GC since the program started.
# TYPE go_memstats_gc_cpu_fraction gauge
These are the metrics being output by your device.
Now, above, we mentioned port 9100. If you remember, when we initially configured our prometheus.yaml file, we put in the IPs of the servers/pi's we wanted to monitor with the port 9100. So that should leave us in an excellent state of where we need to go next.
Note; If you misconfigured the prometheus.YAML file earlier, you can restart the section to set up the Prometheus container. You won't need to re-configure Grafana as it will be using the same port and IP, but you will need to change the container's name as you will have a duplicate container already set up by Docker.
Head to your Prometheus container on port:9090, and at the top of the page, hit "status" and select "targets".
You should now see your devices being fed into Prometheus, thanks to the node_exporter service.
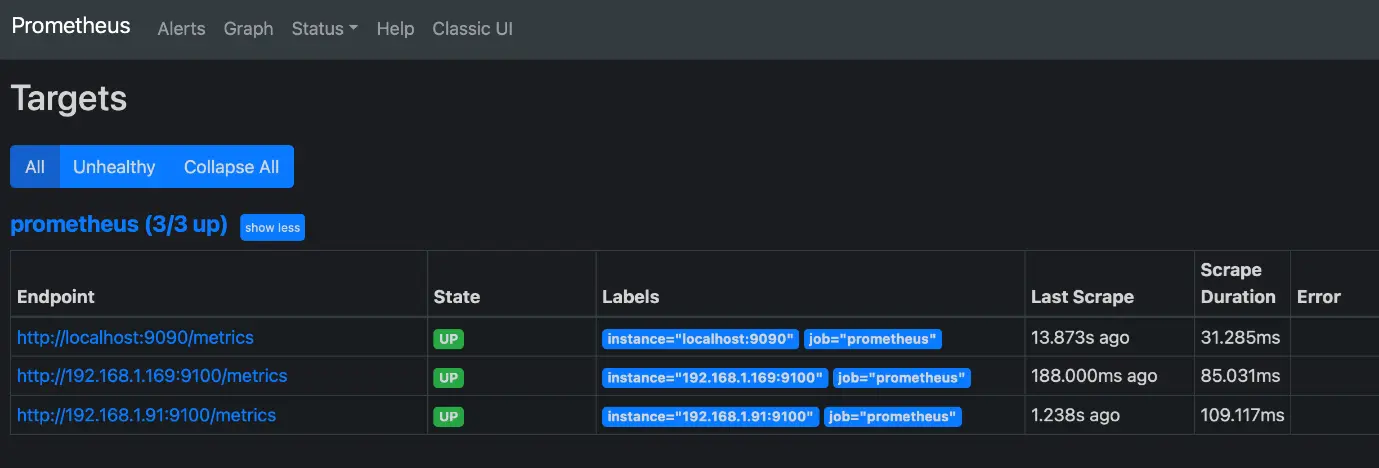
Note: localhost is the containers localhost, which is how we saw the metrics on the Prometheus dashboard earlier.
If these are not up for you, you may have an issue with;
the node_exporter service not running. Prometheus.yaml file not configured correctly Prometheus may need a "boot" Check over your node_exporter service again, visiting the section above where we installed it and tested it via browser.
Check over your Prometheus.yaml file.
Prometheus can be booted by doing the following.
sudo docker ps -a
## grab the container ID or name of the container

sudo docker stop <containerID or Name>
## stops the container.

sudo docker start <containerID or Name>
## starts the container.
Now to see if Grafana can output the data from Prometheus.
Head over to Grafana on port:3000, click the 4 squares/ window again on the left of the page, and select "manage".
We want to import another dashboard to save time and display the output from our devices.

This time, we're going to import dashboard 1860, which can be seen here.
Hit "Import", enter the dashboard ID of 1860 and load.
Congratulations, you now have metrics displayed by the Grafana dashboard of your servers/pi's. We can again set the time periods to display output from, and so on. Below you'll find additional metrics that can be displayed.
If you set up 2 or more devices, you can select the "host" at the top of the screen and display the metrics from your other devices.
This should give you a good starting point to create your own dashboards and move on to streaming metrics from other devices.
Where do I go from here?
I will be looking to stream metrics from my Ubiquiti network, so I look forward to a post shortly when I've configured that, stopped pulling my hair out and written it all down.


